
SSD were engaged to carry out a fleet review with the primary objective of reducing costs. To achieve that, the client asked us to carry out an analysis exercise to challenge the efficiency and effectiveness of their maintenance programme.
Initial observations showed that the ‘target sum’ could be saved from fuel costs alone. Following this we were asked to look a little further.
The broader assessment, including time talking to the experts in the system led to the construct of the graphic below. Having no prior visibility of the system in this way and being pleasantly surprised by the output in the short time-frames the client provided a number of permissions to act with immediate effect.
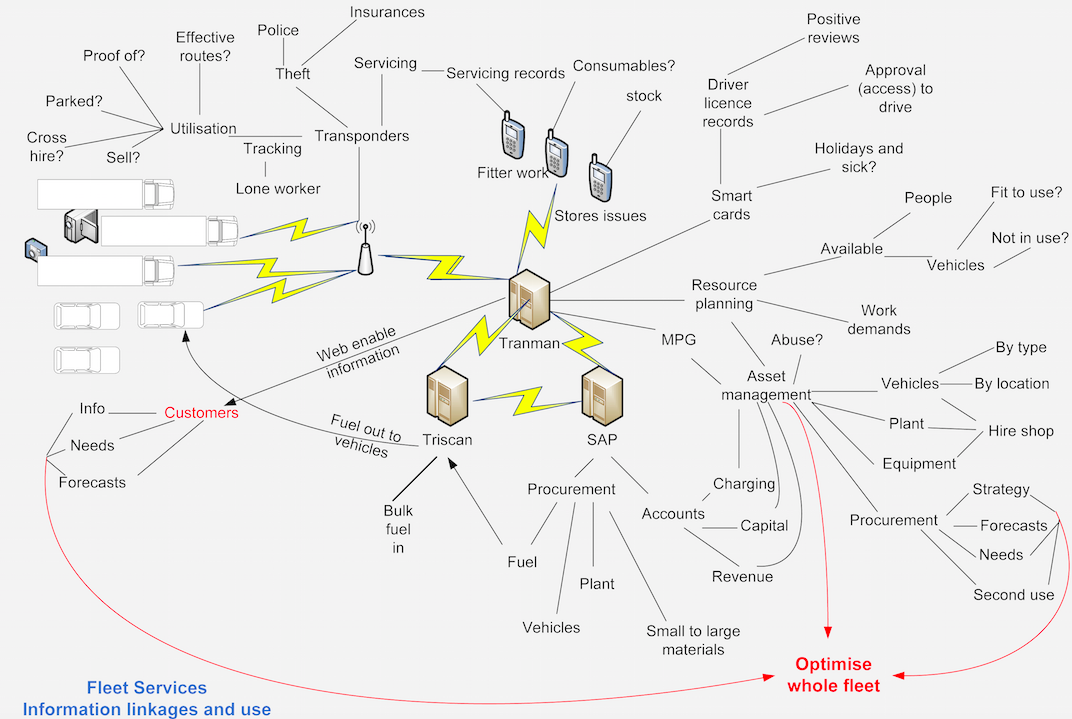
Visualising the process in this way allowed the repeated data entries between the three core ICT systems to be seen clearly. This enabled the quantification of wasted time, duplicated effort and relative cost’s. It also highlighted a sub-system of data corrections which had evolved to rectify poor data entry.
Removal of these non-value adding activities made a number of skilled people excess to requirement seeing HR re-deploy to other areas of the organisation.
While mapping processes around depots an obvious question started to form. Why were so many vehicles not being utilised each day? It turned out many were being retained purely as a source of convenient spare parts for those other vehicles which were also spare in terms of capacity. Others were ‘owned’ by a particular department, who had claimed the exclusive use of them and were fundamentally seen as unavailable for use by others who could have used them.
We also experimented with the vehicle tracking systems available. They turned out to be exceptionally good, able to show usage patterns for most of the fleet. Data included where they parked and for how long they remained there and how they were driven. Surprisingly initial use of this system highlighted several additional vehicles that were parked every day of the week. A lack of utilisation would have been inefficient enough, but we also identified a similar number of vehicles that were on hire to do the same work the parked-up vehicles were designed for.
Having developed a considerable amount of information from our initial analysis activities, around 25 people from around the business attended our three-day ‘Visualising Transformation’ training course to learn the fundamentals of our approach. Following the training course they took part in an all day workshop to identify improvement opportunities as a cross-functional team.
In the first hour of that workshop the opportunities on our benefits realisation plan increased to include sixty five (65) separate aspects of improvement work. From these, seventeen (17) were identified as ‘quick wins’ i.e. things we could get started on quickly to assist the service and save money immediately.
Parallel flow designs enabled one internal customer to save one and a half Full-time administrators having discovered, during their construct within the cross-functional team setting, that there was a fuel issuing system in the organisation that his fleet could use.
RESULTS:
The council saved £1M PA revenue and £5M capital in the first 30 months! This led to more than £10M savings over the following few years. All from a relatively small piece of work, with no redundancies required!
The review and subsequent actions carried out significantly exceeded expectations, leading to further savings in the organisations Passenger Transport department. A more ‘energised’ and inclusive approach was also taken toward a Parking review.
A Fleet Case Study is available on request from [email protected] . It is also available for download from our website at http://www.supportservicesdirect.co.uk/case-studies.html
NOTE Visualising Transformation is a ‘Way of Working’ (WoW) that takes information within a system and translates it into relevant meaning for the people involved, enabling clarity and better, faster decisions.
VT acknowledges that everything is connected and sustainable change comes from a better view of systems.
We would love to hear your thoughts.
For all enquiries contact [email protected]
 RSS Feed