
Most processes can be improved, but rarely does improvement equal most of the process being removed!
At least, not while still providing increased customer benefit!
This short article on ‘Clinical Waste’ details an intervention which saw SSD deliver just such a result.
We were approached to carry out a review of a clinical waste process which fundamentally comprised ‘A man and a van’ travelling around to collect ‘sharps’ and other waste products requiring ‘management’ in line with legislation.
The administration of this part of the process was taking up as much time as the whole of the trade waste services being performed in the same area, which involved far more people and transactions. Something had to be done, but no-one involved could identify a solution.
We used our proprietary methods (Visualising Transformation - VT) to rapidly assess the situation, talking to the experts in the system; with some additional research to ensure opinion could be confirmed with facts. We gathered Data, analysed that data and brought previously disconnected elements together. We then created several ways to visualise and communicate the information back to those involved. We even went out with the man in his van, to create charts and maps (using GIS information). From these activities we were able to demonstrate where the key points of contact were geographically and how the materials and information moved around the system.
We then held two workshops, which included basic training to get people up to speed with the methods we employ within VT.
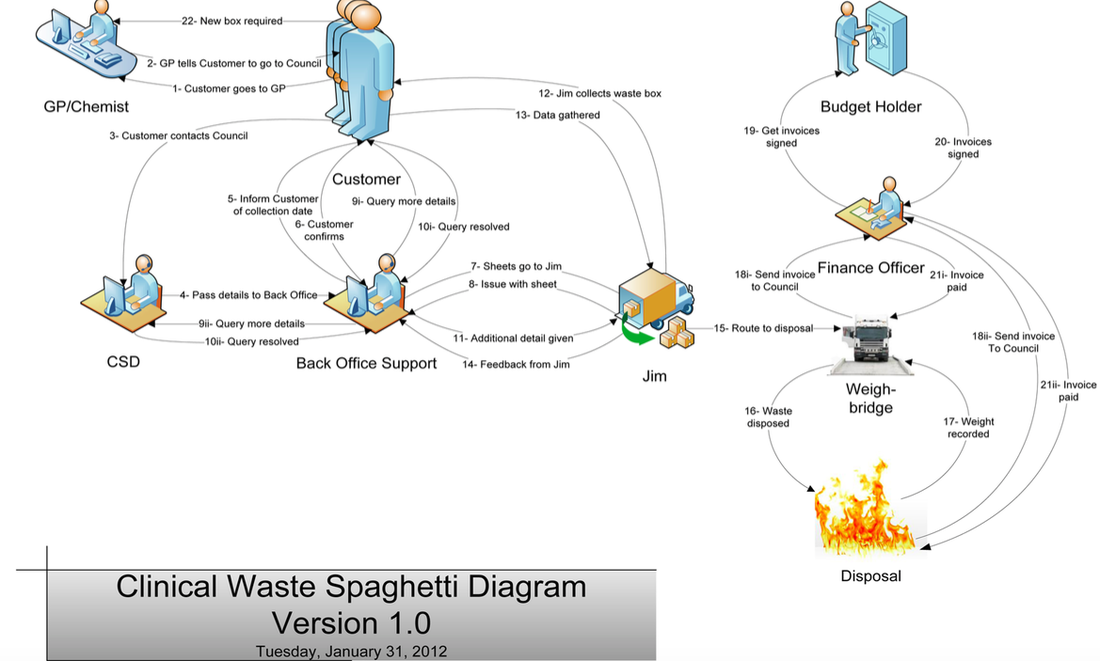
Those workshops were designed to be engaging and provoked a lot of energy. Some extremely good questions and answers resulted in meaningful action plans, which the key stakeholders took ownership of. The ‘spaghetti diagram’ creation within the second workshop was … let’s say … ‘entertaining’! The people producing it found the process they were operating quite incomprehensible when seen visually. We had a few laughs about the design of the system along the way but also came up with a solution that went beyond anyone’s initial expectations.
The GIS maps showed 85% of the daily collections were sensible, but some collections couldn’t have been more wrong.
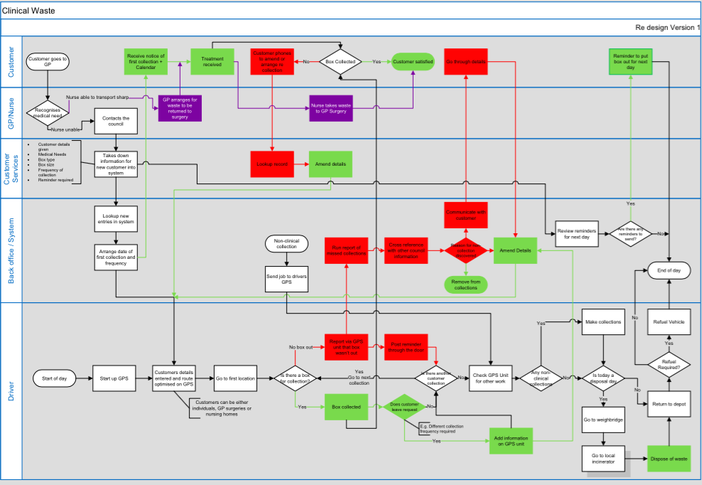
The flow diagrams produced during the workshops looked OK on first inspection; until it was recognised that the back office was ‘too busy’ to cope with changes to the schedule. We went on to identify ‘negative feedback loops’ in the process (forcing unnecessary work) and highlighted them in red on the chart. We then identified ‘positive feedback loops’ in green, for work that reduced subsequent workloads while improving service delivery. We left all other process steps in white. (Fig.1.).
We also included an optimum loop in purple; this required the implementation of a simple dispensation (i.e. a small adjustment to the way in which a policy was being interpreted). This change allowed nurses to carry sharps back to their operating base, removing the need for collection. This simple step enabled a 93% reduction in home collections, creating the capacity required to implement a clinical trade service at a fraction of the previously estimated cost. Following the change, the process under investigation also required far fewer resources to manage it.
We used our proprietary methods (Visualising Transformation - VT) to rapidly assess the situation, talking to the experts in the system; with some additional research to ensure opinion could be confirmed with facts. We gathered Data, analysed that data and brought previously disconnected elements together. We then created several ways to visualise and communicate the information back to those involved. We even went out with the man in his van, to create charts and maps (using GIS information). From these activities we were able to demonstrate where the key points of contact were geographically and how the materials and information moved around the system.
We then held two workshops, which included basic training to get people up to speed with the methods we employ within VT.
Those workshops were designed to be engaging and provoked a lot of energy. Some extremely good questions and answers resulted in meaningful action plans, which the key stakeholders took ownership of. The ‘spaghetti diagram’ creation within the second workshop was … let’s say … ‘entertaining’! The people producing it found the process they were operating quite incomprehensible when seen visually. We had a few laughs about the design of the system along the way but also came up with a solution that went beyond anyone’s initial expectations.
The GIS maps showed 85% of the daily collections were sensible, but some collections couldn’t have been more wrong.
The flow diagrams produced during the workshops looked OK on first inspection; until it was recognised that the back office was ‘too busy’ to cope with changes to the schedule. We went on to identify ‘negative feedback loops’ in the process (forcing unnecessary work) and highlighted them in red on the chart. We then identified ‘positive feedback loops’ in green, for work that reduced subsequent workloads while improving service delivery. We left all other process steps in white. (Fig.1.).
We also included an optimum loop in purple; this required the implementation of a simple dispensation (i.e. a small adjustment to the way in which a policy was being interpreted). This change allowed nurses to carry sharps back to their operating base, removing the need for collection. This simple step enabled a 93% reduction in home collections, creating the capacity required to implement a clinical trade service at a fraction of the previously estimated cost. Following the change, the process under investigation also required far fewer resources to manage it.
The review massively exceeded expectations, seeing the majority of the process removed, while improving service delivery and customer benefits. It also provided an opportunity to look at a full-blown waste review.
This is just one example of the kind of work SSD enjoy doing and the benefits provided to customers through our ‘rapid deployment’ interventions.
A ‘Rethinking Waste Management’ paper is available on request from [email protected] . It is also available for download from our website at http://www.supportservicesdirect.co.uk/case-studies.html
NOTE Visualising Transformation is a ‘Way of Working’ (WoW) that takes information within a system and translates it into relevant meaning for the people involved, enabling clarity and better, faster decisions.
VT acknowledges that everything is connected and sustainable change comes from a better view of systems.
We would love to hear your thoughts.
For all enquiries contact [email protected]
 RSS Feed